Mission and Goals
Imaging the cell biological events that drive the formation of new metastatic tumors in situ
Research Test-Bed 1
Shifts in intra- and intercellular signals are associated with changes in expression of the membrane adaptor protein Caveolin-1. How do these interacting changes affect the metastatic propensity of pediatric sarcoma?
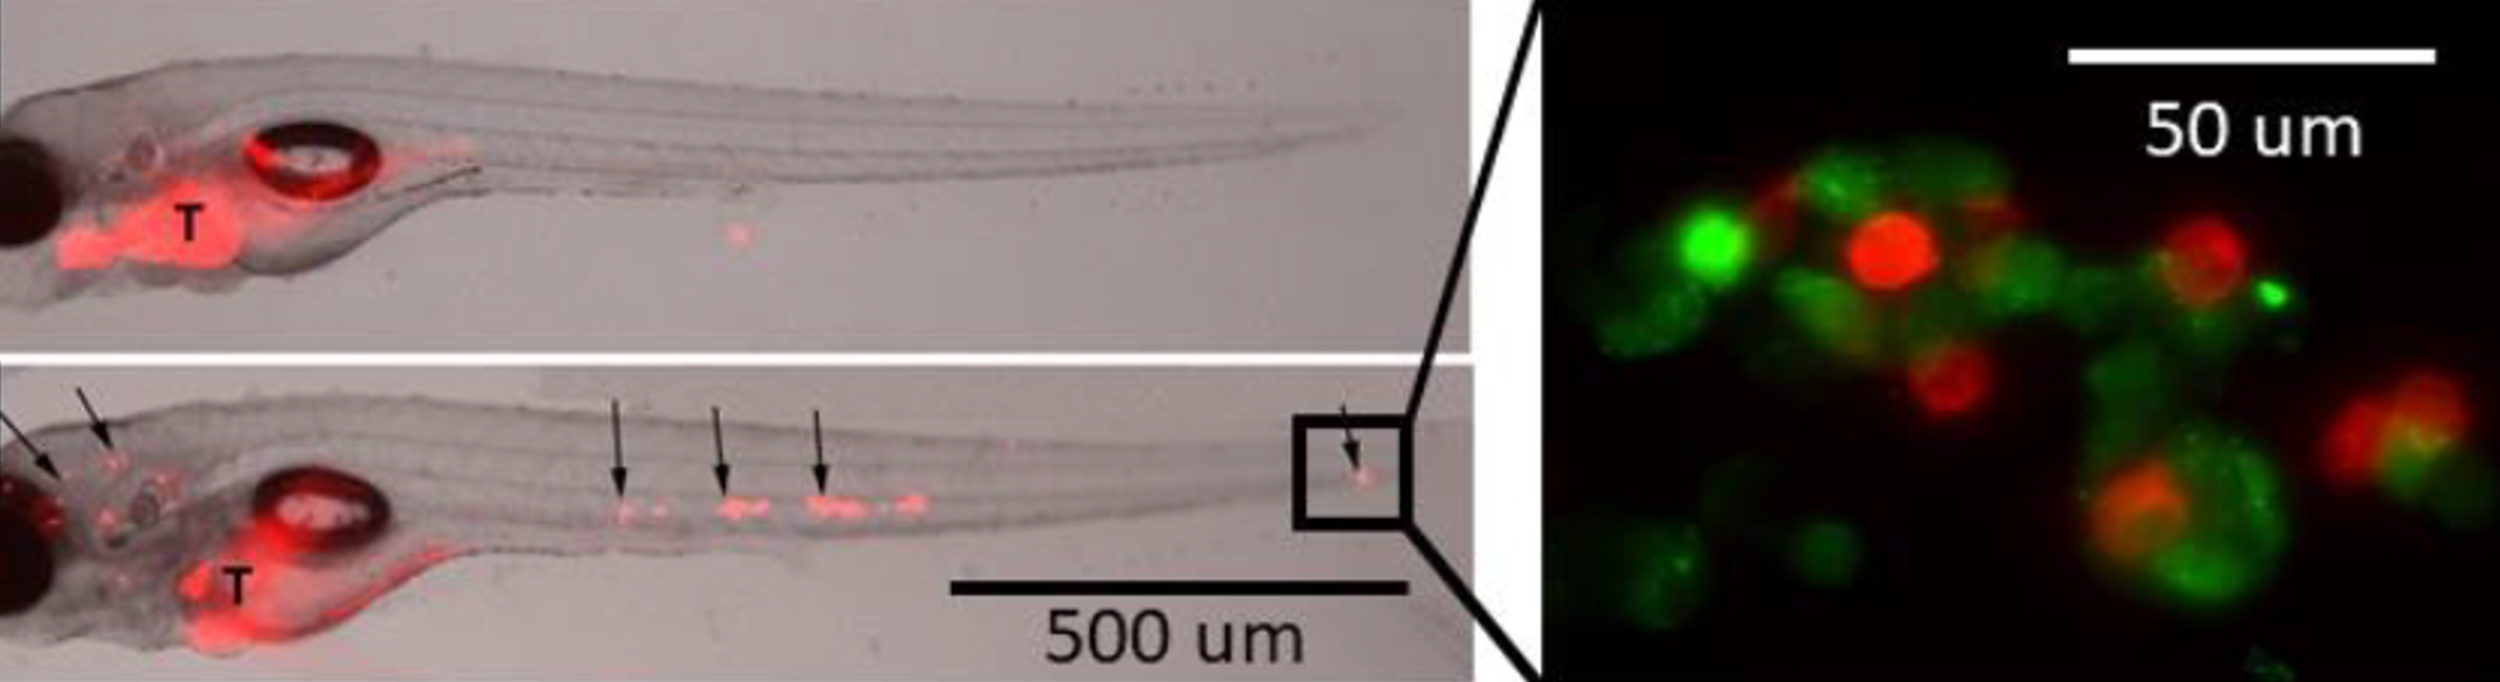
Xenografts in Zebrafish. Top left panel: TC32 Ewing sarcoma cells stably labeled with DsRed engrafted in Zebrafish & establishment of primary tumor xenograft (T) 2 days post-implantation. Bottom left panel: Metastatic colonies in the head, torso and tail (arrows). Right panel: Light-sheet imaging of a mosaic labeled colony.
Research Test-Bed 2
Lipid metabolism varies greatly in cancer cells due to factors both intrinsic and extrinsic to the cells. What effects do these variations have upon melanoma metastasis patterns?
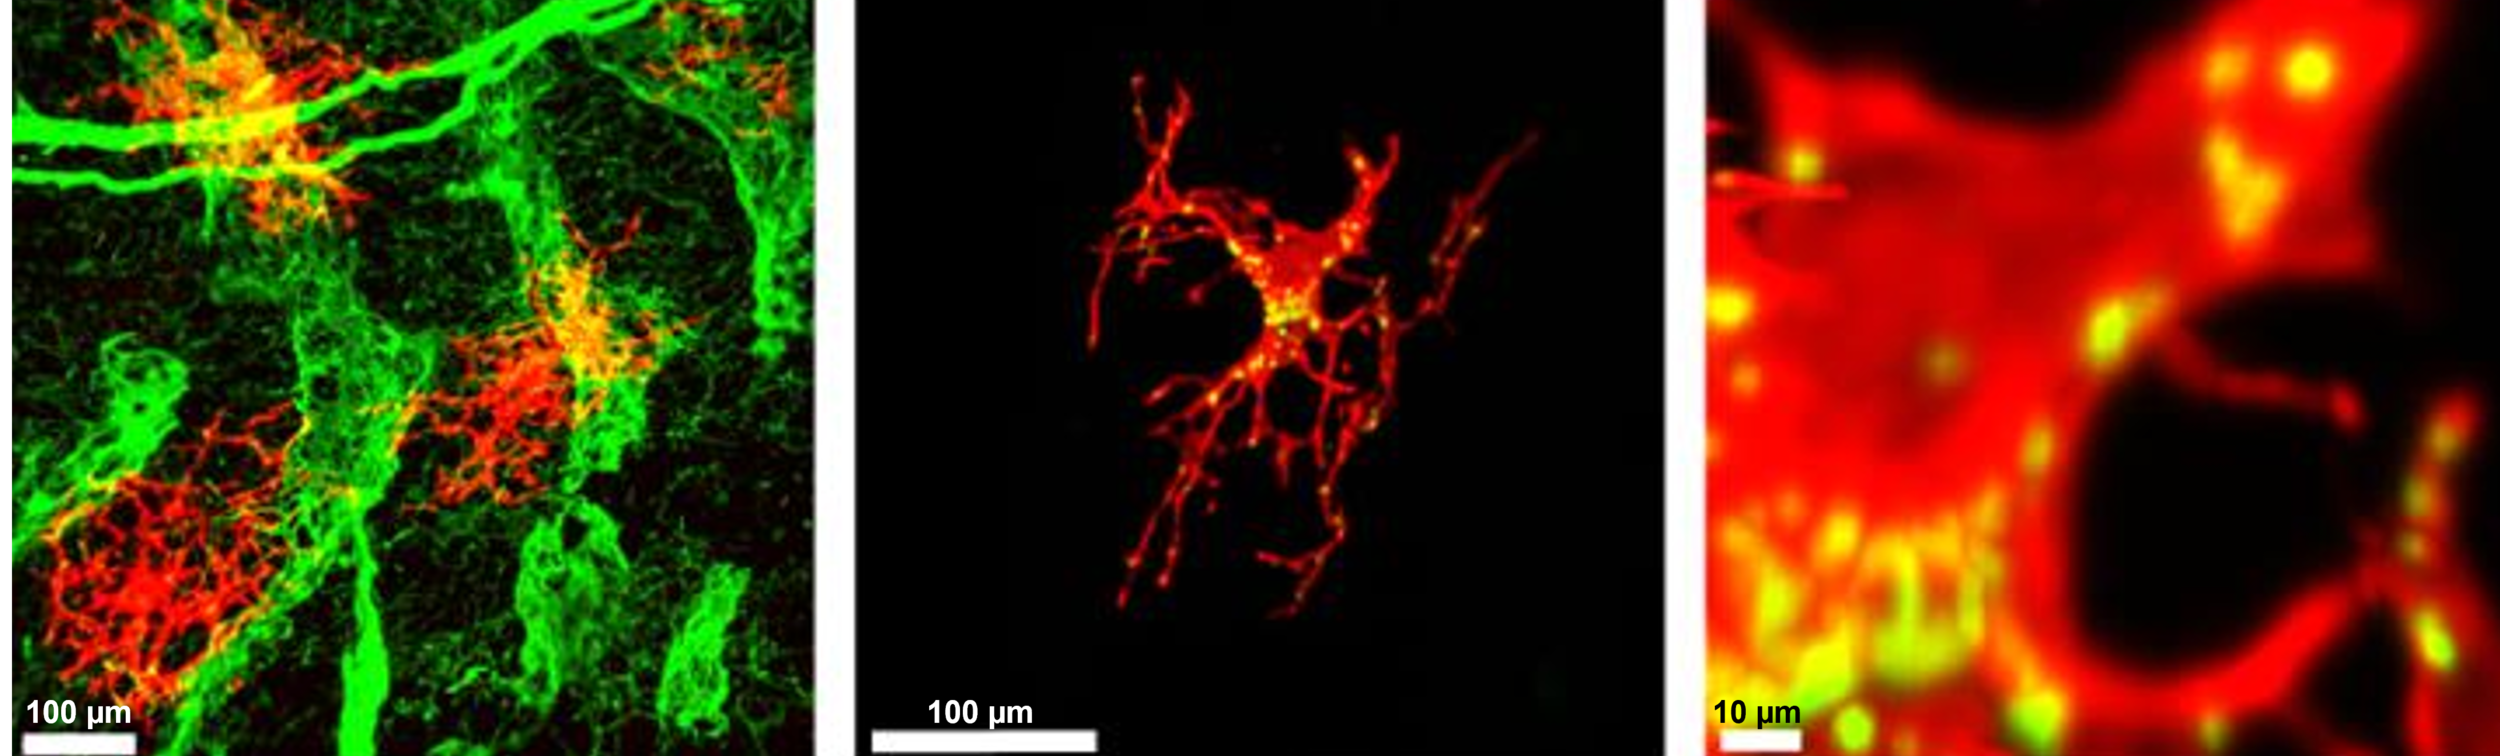
Lipid metabolism in tumor cells. Left panel: Mitochondrial networks in LepR+ cells associated with sinusoids in the HSC niche. Cleared mouse bone marrow with LepR+ stromal cells (red) adjacent to sinusoidal blood vessels (laminin, green). Middle panel: LepR+ cells (red) containing mito-dendra2+ mitochondria (green-appearing yellow). Right panel: Zoomed in image of LepR+ cells.
Technology Development Unit 1
A multi-modal multi-scale live imaging platform is being developed to examine effects of microenvironmental variation across an organism and characterize the cell-intrinsic heterogeneity on metastatic spreading. Using xenografts of human tumors into zebrafish embryos, this microscope is built to dynamically and seamlessly switch from high-throughput screening mode to high-resolution (300nm) imaging mode. This allows observation of metastatic patterns in tens to hundreds of embryos, followed by detailed analysis of molecular, metabolic, morphologic, and proliferation/survival states of individual cells within an emerging metastatic niche.
Light Sheet microscopy for Zebrafish embryo. Top panel: In-vivo light-sheet imaging over an entire Zebrafish embryo with xenografted Ewing sarcoma cells. Vasculature labeled with Fli:GFP and Ewing Sarcomas with LSSmOrange (magenta). Bottom panels: a group (left) and individual cells (right). Arrows indicate protrusions and non-apoptotic blebbing.

Technology Development Unit 2

A multi-scale imaging platform is being developed to use hyper-spectral analysis to investigate the molecular, metabolic, morphological, and functional states of metastatic cells across entire mouse organs. This system will leverage advances in tissue clearing, automated high-speed, high-resolution light sheet microscopy, and computer vision to integrate mesoscopic imaging at 5-10 micron and nanoscopic imaging at 300nm throughout a 300 micron field of view within the organ. Accelerated 60-plex cyclic immunofluorescence assays will then be designed to comprehensively characterize colonizing cells in thick tissue sections.
Deep imaging within the hematopoietic stem cell niche at ~300nm isotropic resolution. Magenta - cKit-positive progenitor cells. Green - nerve fibers. Gray - sinusoids. Orange - arterioles.